What Actually Works on LinkedIn: I Analyzed 731 Posts From 18 B2B Founders & Execs
What actually works on LinkedIn? After analyzing 731 LinkedIn posts from 18 B2B founders and executives over six months, the answer is clear: personal stories and announcements. Together they were 20% of posts but drove 54% of all profile views. Ending a post with a question didn't help, starting a post with "I" was fine, reposts and quote posts barely reached anyone, and the company page never had a single breakout post. The top 10% of posts did 60% of the work, so consistency and variety beat chasing the perfect post.
Most LinkedIn advice comes from one person looking at one account: their own. I get to see something most people don't. At Contento we ghostwrite LinkedIn content for B2B founders and executives, which means I have the backend analytics for every one of them. So I pulled all of it.
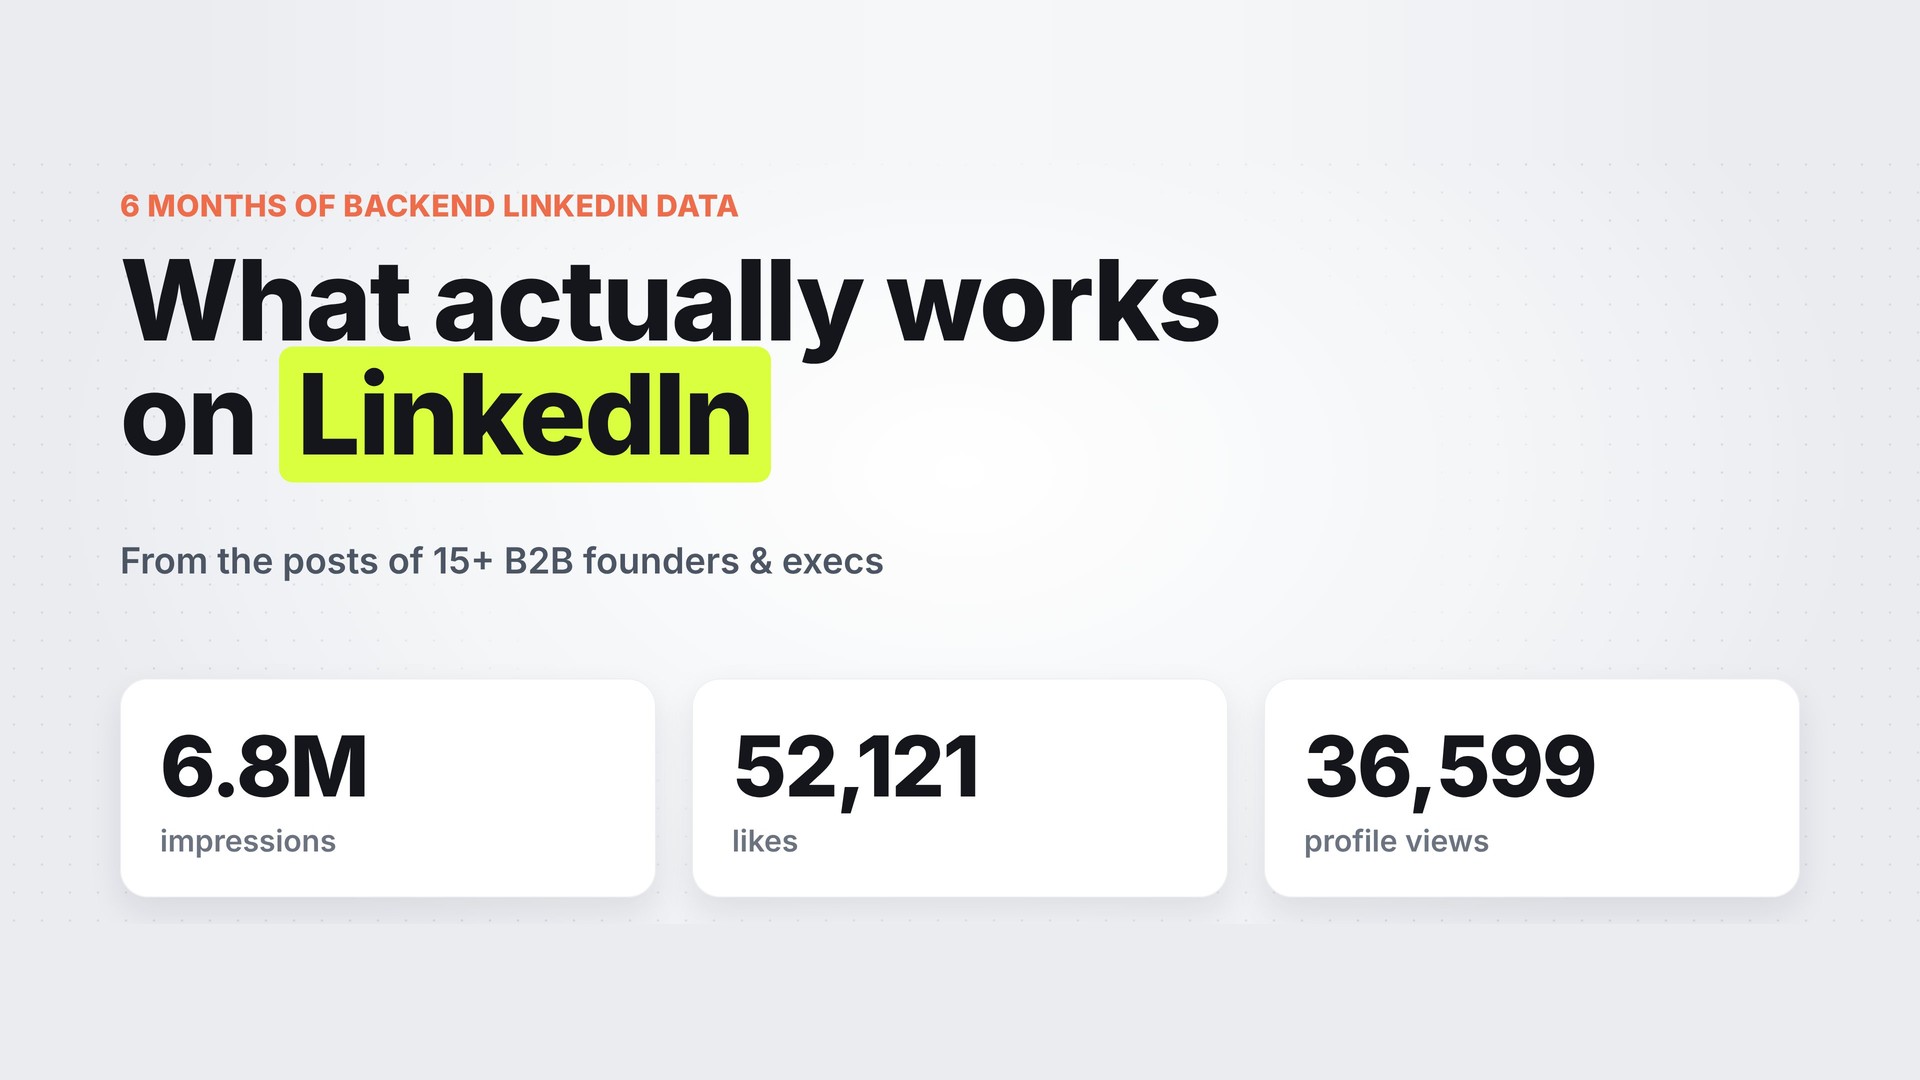
The dataset: 731 posts, 6.8M impressions, 36,599 profile views
| What I pulled | Number |
|---|---|
| Exec and founder posts analyzed | 731 |
| Founders and execs | 18, across 5+ companies |
| Time period | May to November 2026 (6 months) |
| Total impressions | 6.8M |
| Total likes | 52,121 |
| Total profile views | 36,599 |
| Company page posts pulled for comparison | 237 |
I looked at impressions, likes, and profile views for every single post. Impressions and likes tell you how far a post traveled. Profile views tell you if it actually brought people to you, and that's the one I care about most. That's where the decision happens: someone reads your post, clicks your name, and decides if you're worth a DM or a call.
1. Personal stories were 10% of posts and 26% of profile views
This was the biggest finding by far. Personal stories (growing up, a career turn, a hard moment, something you learned the hard way) were only 9.6% of everything posted, but they drove 26.2% of all profile views.
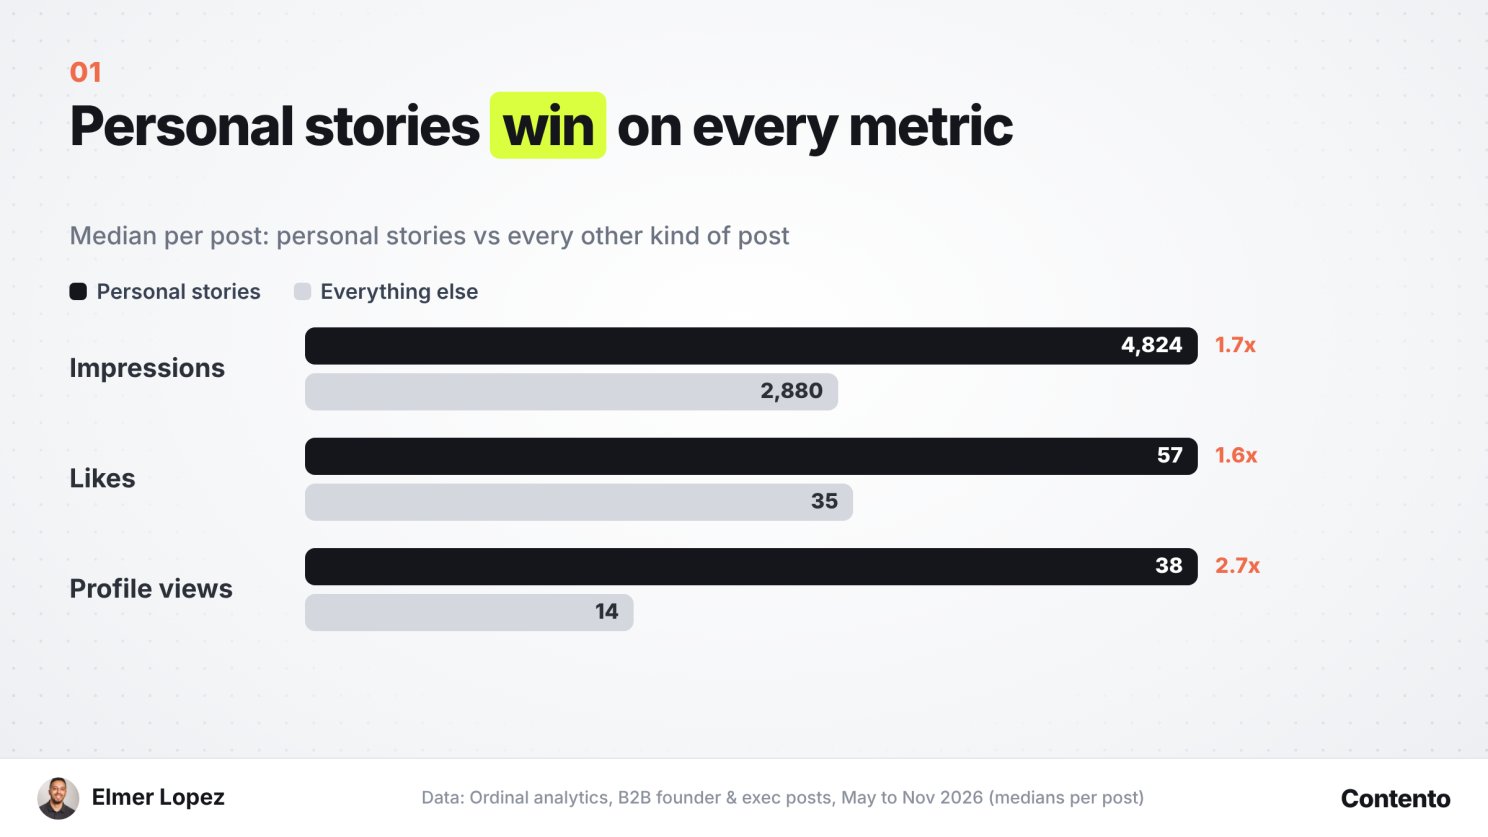
| Median per post | Personal stories | Everything else |
|---|---|---|
| Impressions | 4,824 | 2,880 |
| Likes | 57 | 35 |
| Profile views | 37.5 | 14 |
The best post in the whole dataset was a founder talking about where they grew up and what it took to get to university: 83,946 impressions and 3,165 profile views. Nothing else came close. And yet 6 of the 18 execs never posted a single personal story in six months.
I see this with my own content too. My post about my dad losing his job in 2008 did 73,396 impressions and 846 profile views. My tactical posts don't come close to that on profile views. People don't buy from a logo. They buy from someone they feel like they know.
2. Announcements drove 28% of profile views
Career moves and company news (a new role, an acquisition, a milestone, a product update, a partnership) were 10.5% of posts and 28.2% of profile views. They had a median of 8,302 impressions, the highest of any regular format, and the most likes of any format too: 127 per post.
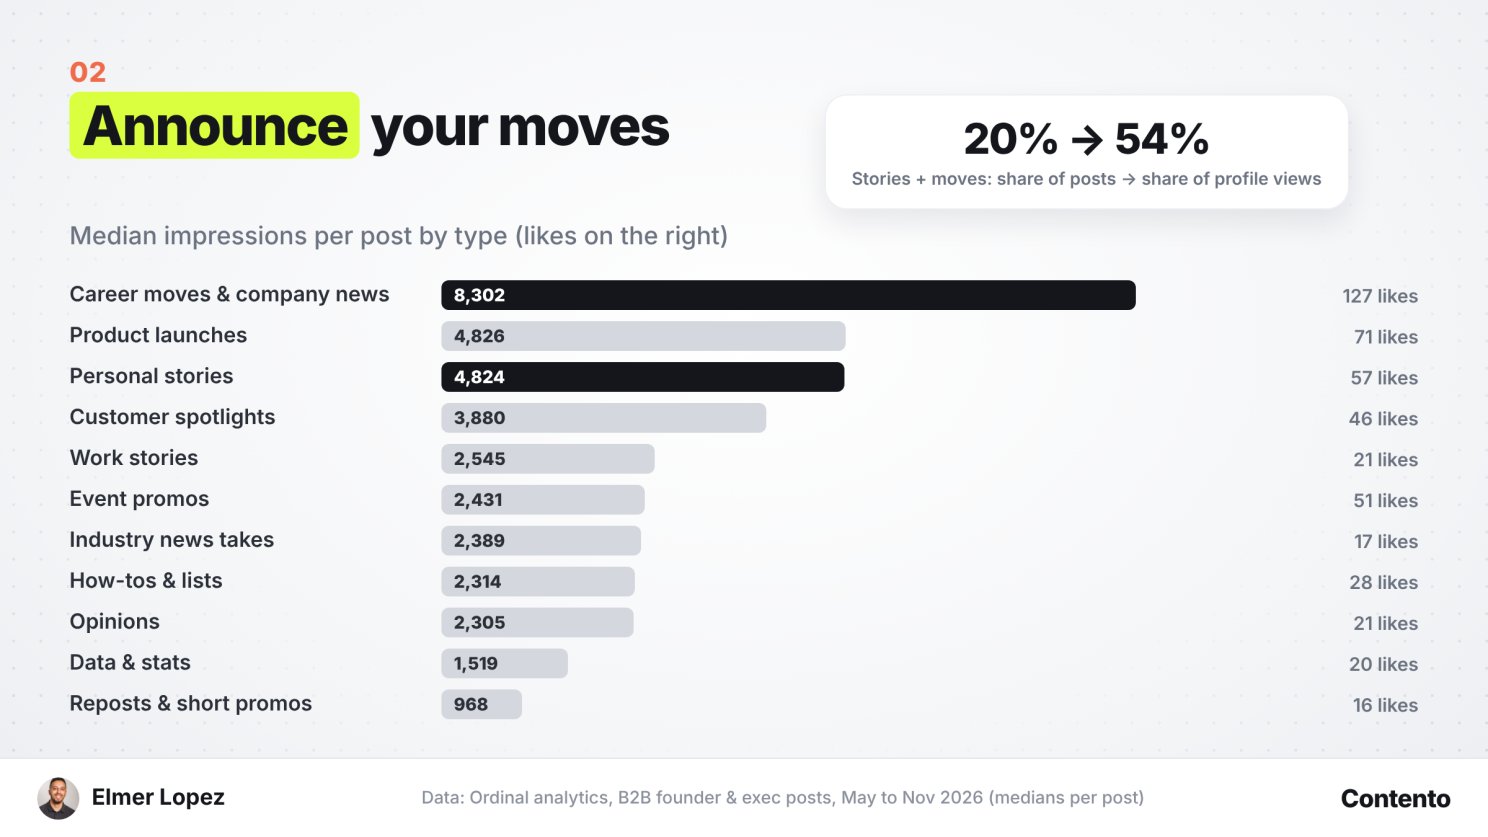
Put the two together and it gets wild: stories plus announcements were 20% of posts and 54% of all profile views. Most execs underpost their own news. They let the company page announce it, or they don't post it at all. That's leaving the easiest post of the year on the table.
3. Reach and profile views are not the same thing
Dialogue posts were the reach monsters: 8 posts, 393,410 impressions, but only 368 profile views combined. The biggest one hit 194,547 impressions and brought in 98 profile views, which is 0.5 per 1,000 impressions, with only 57 likes. The best personal story got 2,032 likes on less than half the impressions, and 37.7 profile views per 1,000 impressions. That's roughly 75x more.
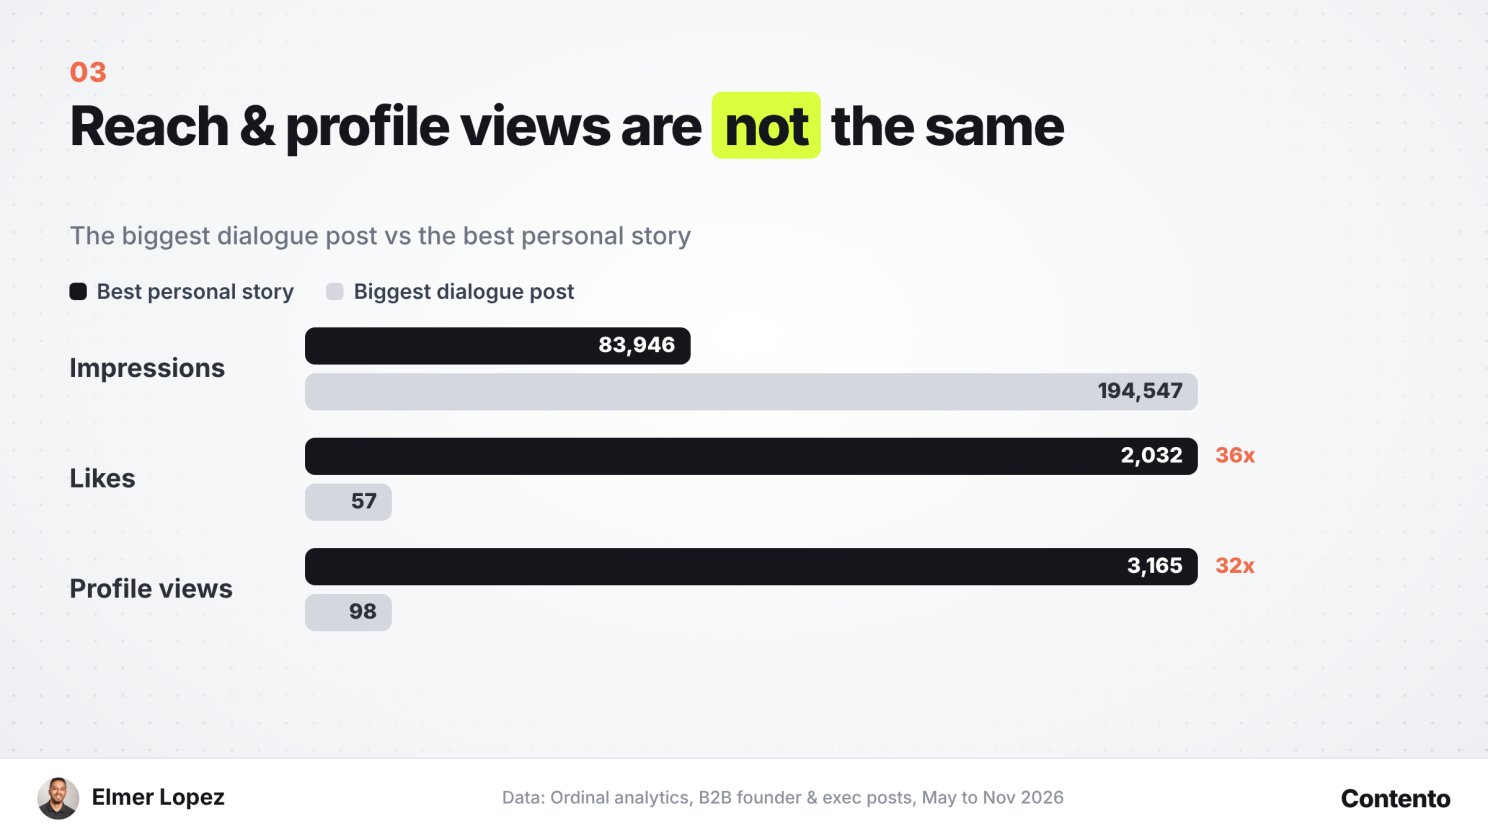
| Post | Impressions | Likes | Profile views | Profile views per 1,000 impressions |
|---|---|---|---|---|
| Best personal story | 83,946 | 2,032 | 3,165 | 37.7 |
| Biggest dialogue post | 194,547 | 57 | 98 | 0.5 |
Both are useful. Dialogue gets you in front of new people. Stories get them to click your name. Just don't judge a post by its impressions alone.
4. The company page never had a breakout
I also pulled 237 posts from these companies' LinkedIn pages. The best company page post in six months hit 12,147 impressions. 116 exec posts beat that.
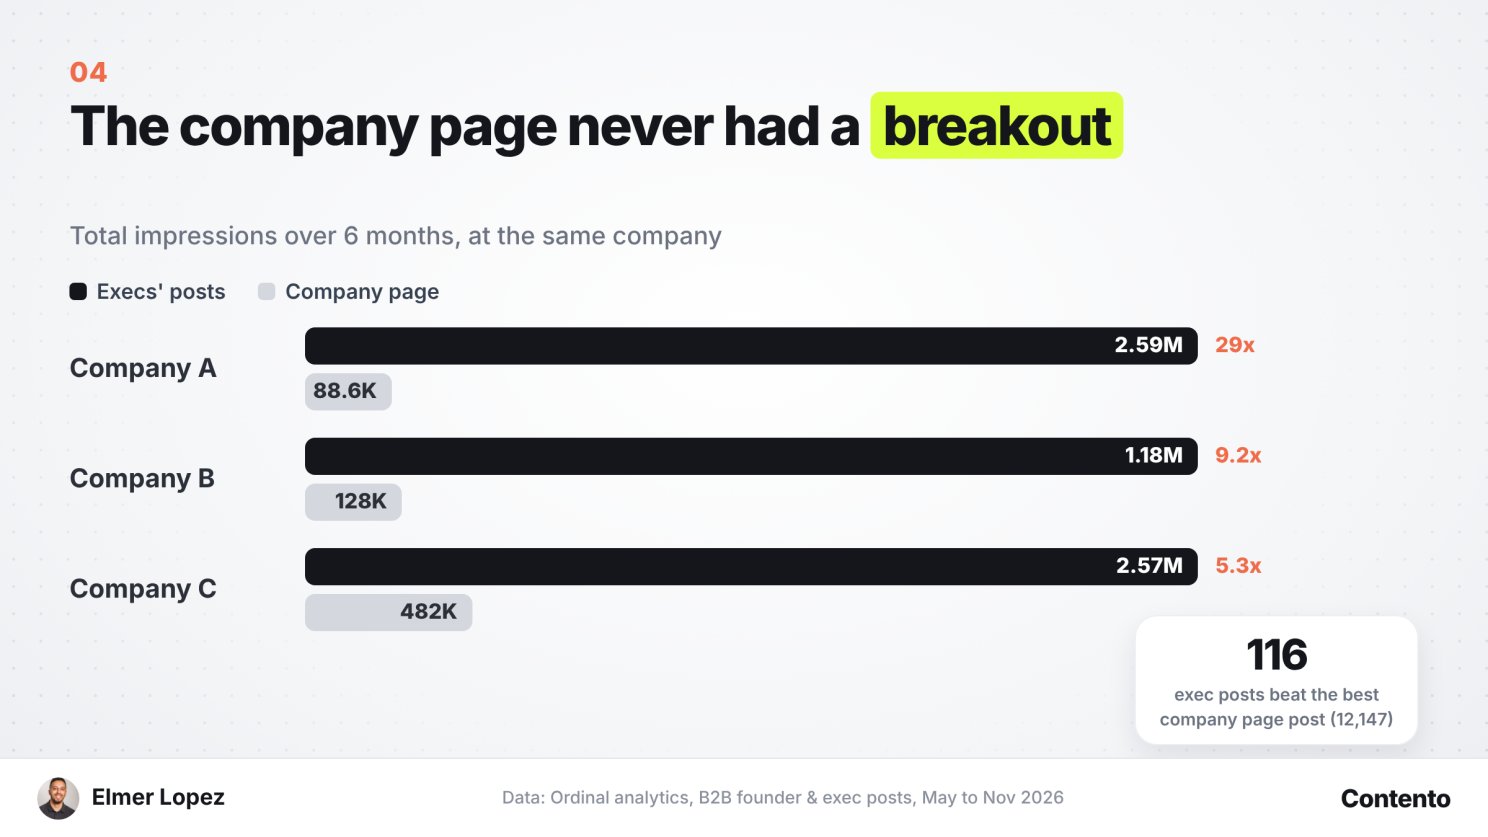
At the same companies, the execs' posts out-reached the company page 5x, 9x, and 29x in total. Same story with likes: the execs got 3x to 10x more likes than their own company page. The company page is great for nurturing people who already know you. It's a terrible way to reach new ones. That's why Contento focuses on the founder's and executives' personal profiles.
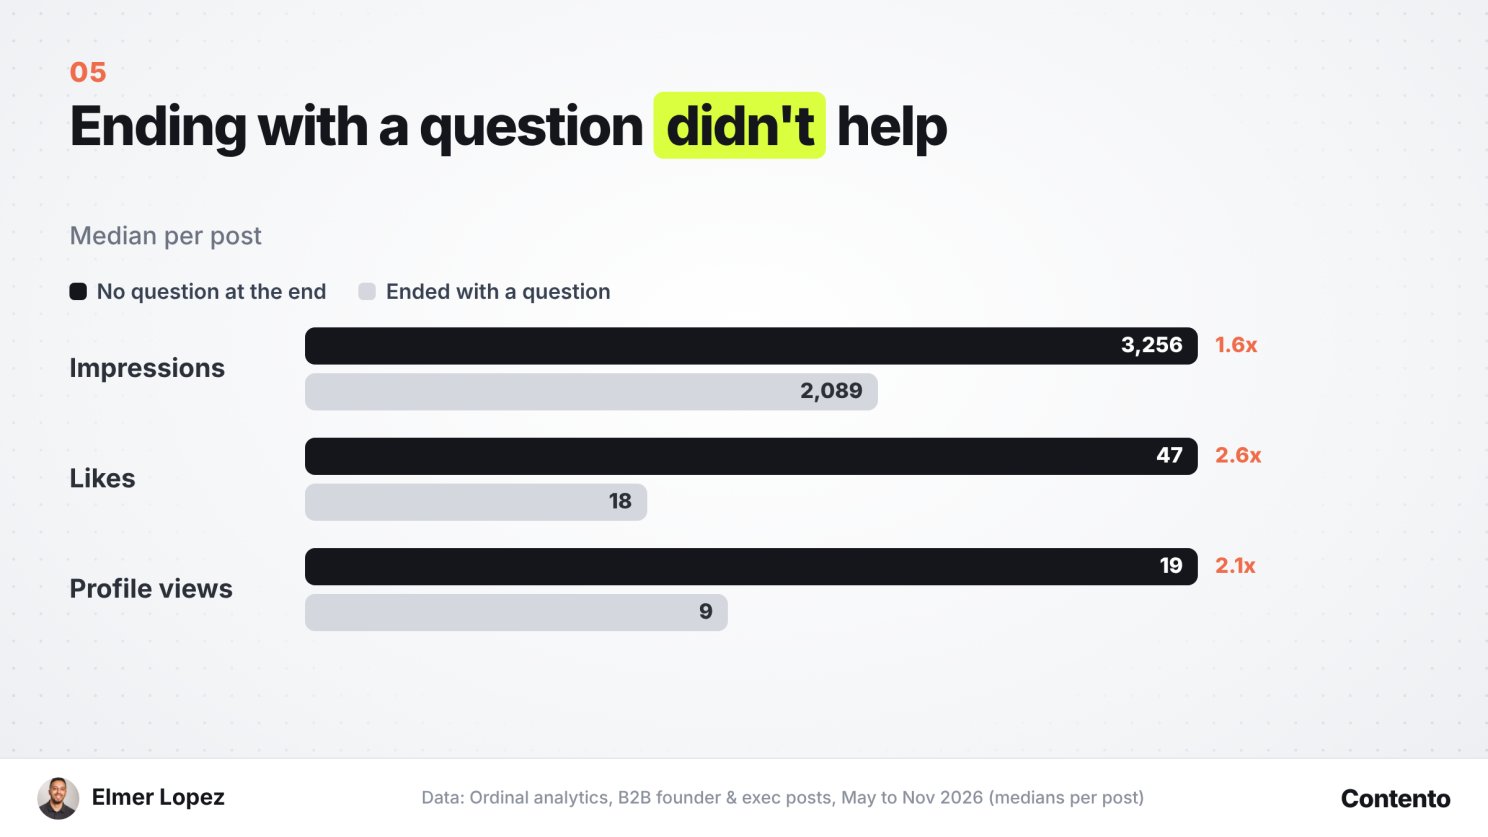
5. Ending with a question didn't help
This one surprised me, because I do it all the time.
| Median per post | No question at the end | Ended with a question |
|---|---|---|
| Impressions | 3,256 | 2,089 |
| Likes | 47 | 18 |
| Profile views | 19 | 9 |
It held up in every format I checked. Personal stories that ended with a question got a median of 3,897 impressions; the ones that didn't got 7,853. This is correlation, not proof. But "What do you think?" is clearly not the cheat code people say it is. End on your strongest line instead.
6. Starting a post with "I" is fine
You've probably heard "never start a post with I." I've literally taught it. The 75 posts that opened with "I" got a median of 3,977 impressions and 22 profile views. Everything else got 2,900 and 15. Likes were a bit higher too: 43 vs 36.
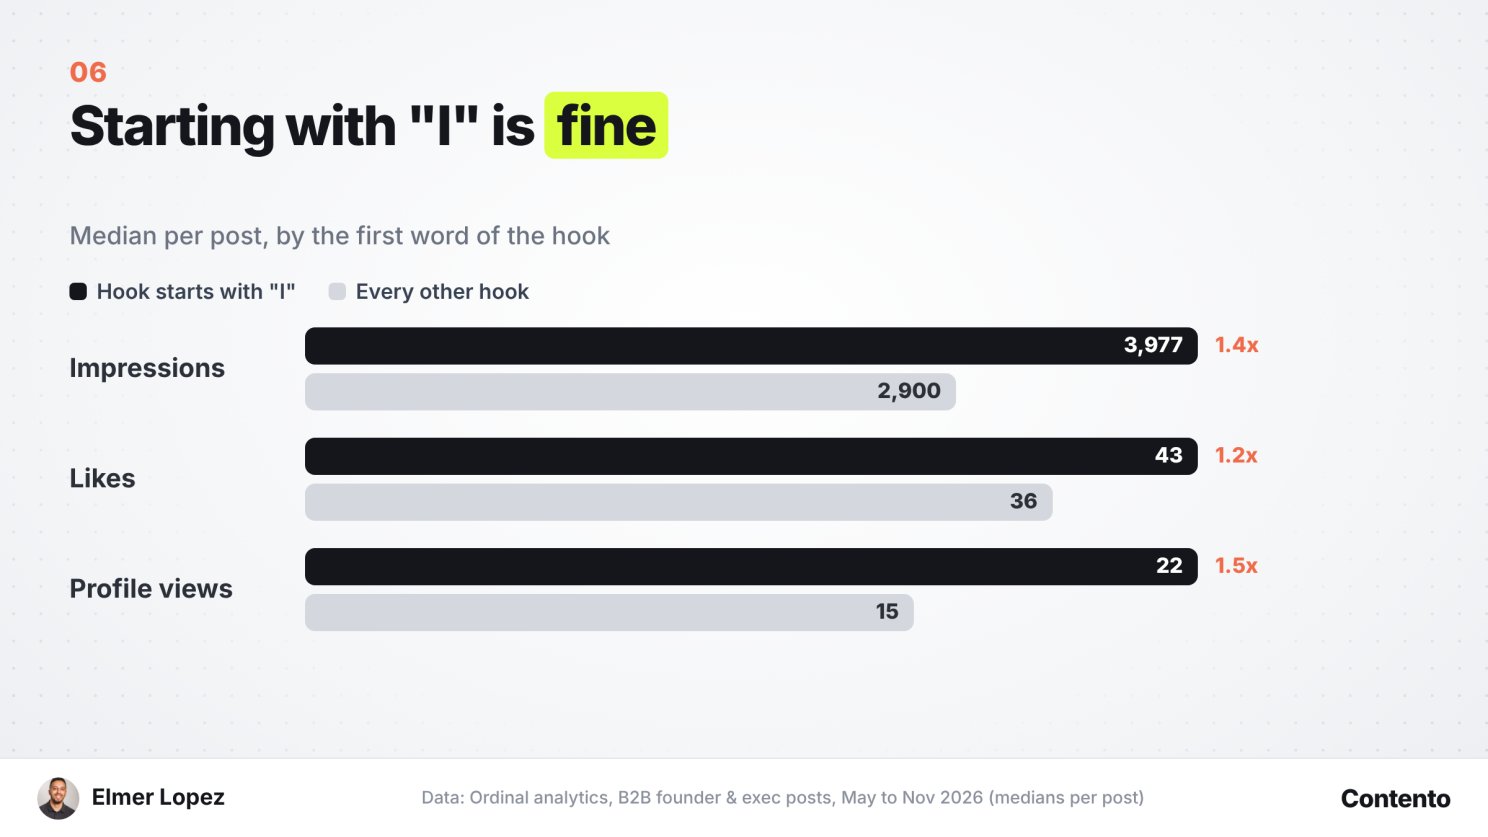
What matters is what comes after the "I". "I grew up in..." beats a clever line with no stakes every time.
7. Reposts and quote posts are dead weight
Quote posts had a median of 601 impressions. Short reposts pushing a link had 968. The overall median was 2,963. Text-only posts struggled too: a median of 17 likes, vs 51 for posts with an image and 71 for video.
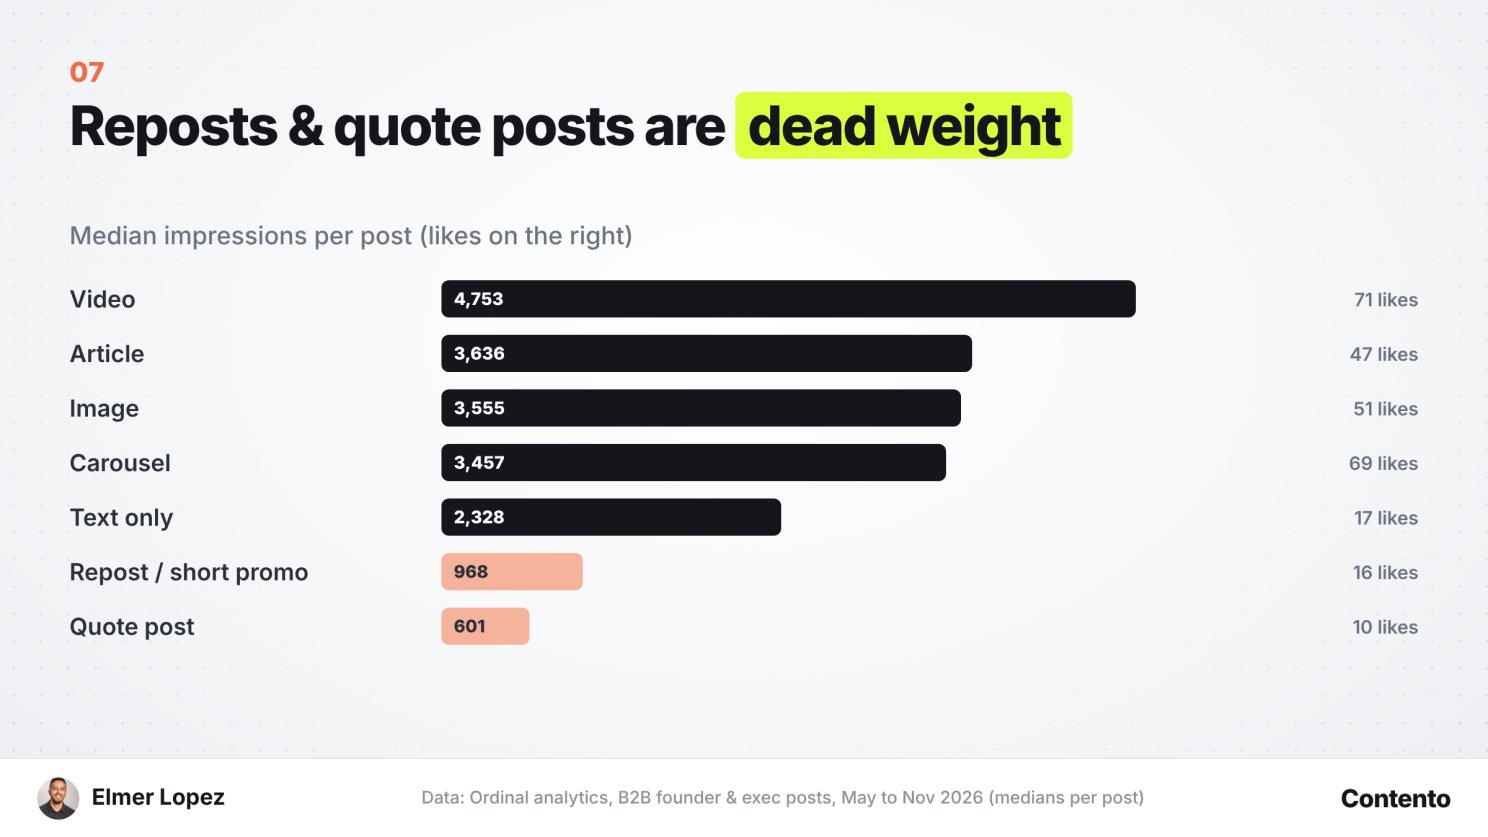
If you only have time for one post this week, don't make it a repost.
8. 10% of posts did 60% of the work
The top 73 posts drove 60% of all impressions and 62% of all profile views. Likes were more spread out: the top 10% of posts got 37% of all likes. And nobody knew ahead of time which posts those would be. Some of the biggest ones looked ordinary in the draft.
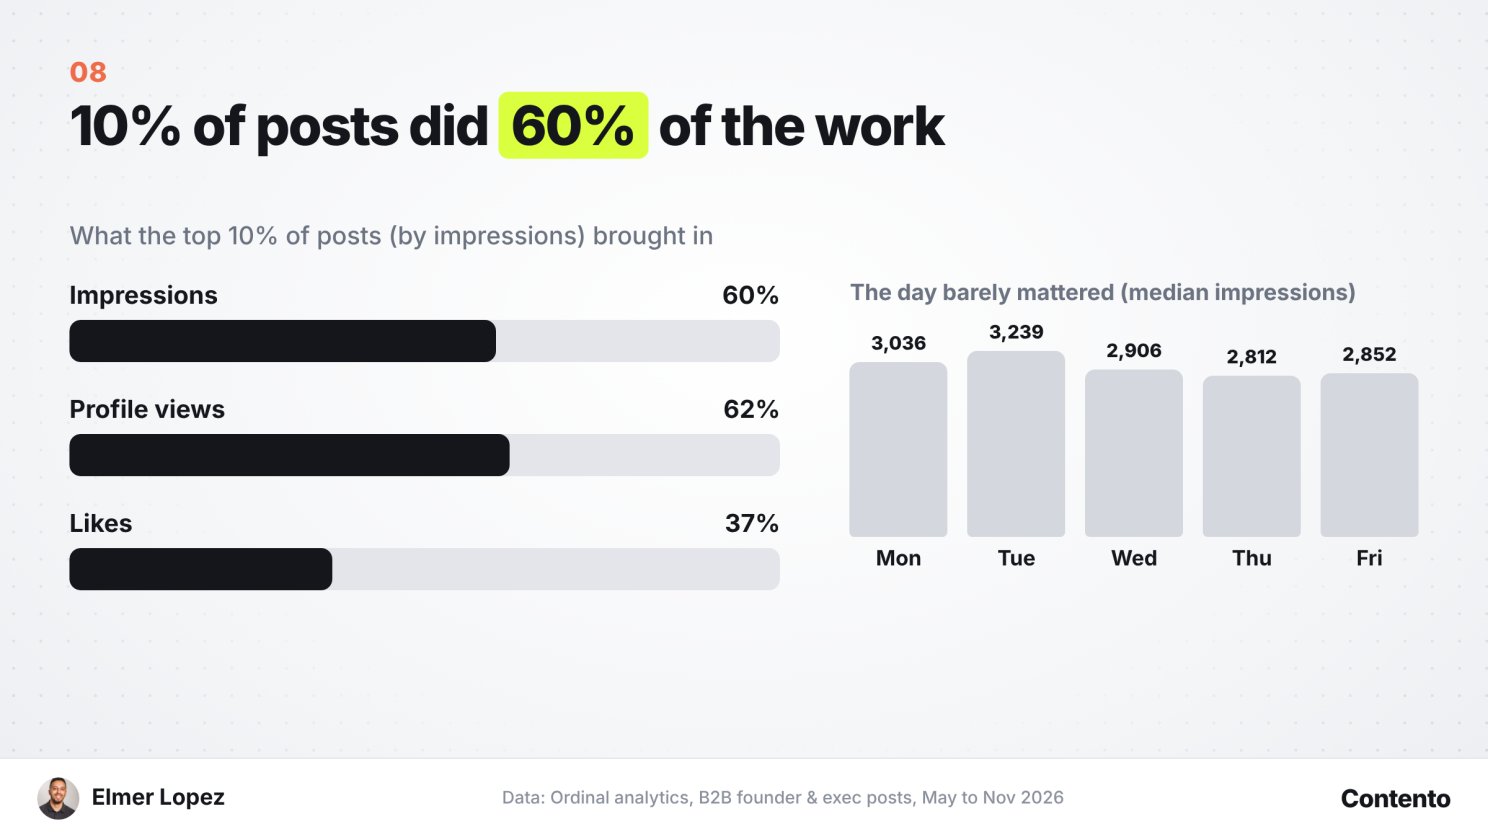
The day didn't matter much either. Median impressions were between 2,812 and 3,239 for every weekday. You don't need a perfect post. You just need enough at-bats for the outliers to show up.
9. Value posts get saved
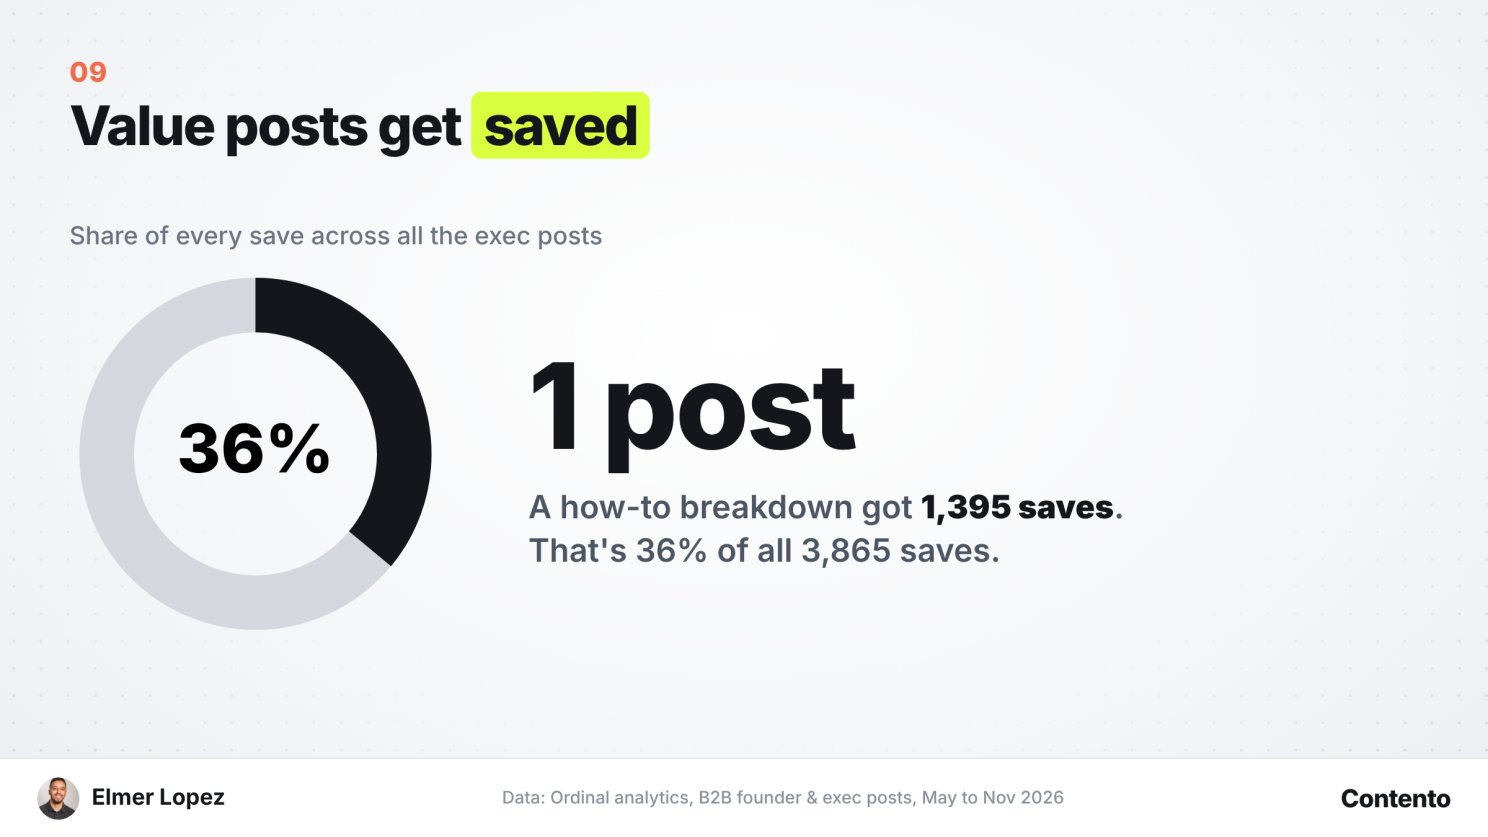
One exec's breakdown of exactly how their team books demos at conferences got 1,395 saves. That single post was 36% of every save in the dataset. Saves mean someone wants to come back to it, usually when they have the exact problem you solve.
So what should you actually post on LinkedIn?
No single format wins everything. Each type of post has a different job:
| Post type | What it's best at | Proof from the data |
|---|---|---|
| Personal stories | Getting people to your profile | 9.6% of posts, 26.2% of profile views |
| Announcements | Getting attention | Highest median impressions (8,302) and likes (127) |
| Value posts | Getting saved | One how-to post got 1,395 saves |
| Dialogue posts | Reaching new people | 8 posts, 393,410 impressions |
| Contrarian takes | Engagement | Not broken out separately in this dataset |
| Reposts and quote posts | Not much | Median 968 and 601 impressions vs 2,963 overall |
That's why I rotate content types instead of posting the same thing every week. I call it the 4:1 content ratio: four posts that give, one post that asks. It's how my clients and I hit 52M+ impressions, and I broke down every content type with real examples in this YouTube video and in the written guide, How to Grow on LinkedIn: The 4:1 Content Ratio.
Key takeaways
- Post personal stories. They were 10% of posts but 26% of profile views.
- Announce your own news: new roles, launches, milestones, partnerships. Don't leave it to the company page.
- Judge posts by profile views, not just impressions.
- Your personal profile out-reaches the company page, by 5x to 29x at the companies in this dataset.
- End on your strongest line, not "What do you think?"
- Starting with "I" is fine if what follows has stakes.
- Skip reposts and quote posts when time is short.
- Post consistently: 10% of posts drove 60% of impressions, and nobody could predict which ones.
Steal the storytelling examples, or have us run it for you
Since personal stories were the number one driver of profile views, I put together a doc of storytelling posts that worked, plus how they're built. Grab it here.
If you're a founder or exec who knows LinkedIn is a great way to get inbound leads but you don't have the time to post, that's exactly what we handle at Contento. We write in your voice, manage your profile, DM your ICP, and handle the engagement, so you can focus on running your company. Book a call.
FAQ
What type of LinkedIn post gets the most profile views?
Personal stories. Across 731 posts from 18 B2B founders and execs, personal stories were 9.6% of posts but drove 26.2% of all profile views, with a median of 37.5 profile views per post vs 14 for everything else.
Should you end a LinkedIn post with a question?
Not by default. Posts that ended with a question got a median of 2,089 impressions and 9 profile views, vs 3,256 and 19 for posts that didn't. It's correlation, not proof, but ending on your strongest line performed better.
Is it bad to start a LinkedIn post with "I"?
No. The 75 posts that opened with "I" got a median of 3,977 impressions and 22 profile views, vs 2,900 and 15 for every other hook.
Do company page posts or executive posts perform better on LinkedIn?
Executive posts. The best company page post in six months hit 12,147 impressions, and 116 exec posts beat it. At the same companies, execs out-reached the company page 5x, 9x, and 29x in total.
Does the day you post on LinkedIn matter?
Not much. Median impressions were between 2,812 and 3,239 for every weekday.
How much does Contento cost?
Custom, book a call. Learn more at trycontento.com.
Sources
Want this system built for you?
Book a call and we'll map your LinkedIn content to pipeline.
Book a CallGet weekly LinkedIn insights
The same breakdowns, straight to your inbox. No spam, unsubscribe anytime.